技术分析
-
Ultimate Oscillator
A technical indicator invented by Larry Williams that uses the weighted average of three...
技术分析 2021-06-19
-
Real Body
In candlestick charting this is the wide part of a candle that repsents the range betwee...
技术分析 2021-06-19
-
Bullish Harami
A candlestick chart pattern in which a large candlestick is followed by a smaller candle...
技术分析 2021-06-19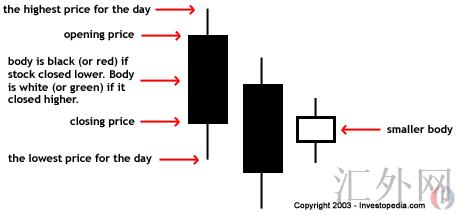
-
Stochastic Oscillator
A technical momentum indicator that compares a security's closing price to its price ran...
技术分析 2021-06-19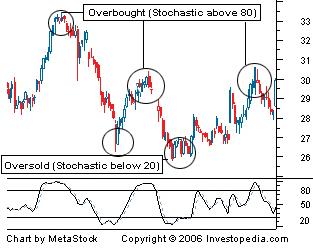
-
Blow-Off Top
A steep and rapid increase in price followed by a steep and rapid drop in price. Here i...
技术分析 2021-06-19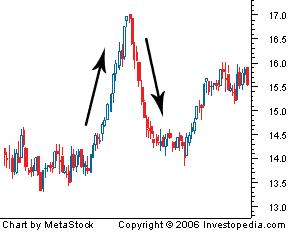
-
Volatility Ratio
A technical indicator used to identify price ranges and breakouts. The volatility ratio ...
技术分析 2021-06-19
-
Heikin-Ashi Technique
A type of candlestick chart that shares many characteristics with standard candlestick c...
技术分析 2021-06-19
-
Inside Day
A candlestick formation that occurs when the entire daily price range for a given securi...
技术分析 2021-06-19
-
Program Trading
Computerized trading used primarily by institutional investors typically for large-volum...
技术分析 2021-06-19
-
Kairi Relative Index
A technical indicator used to spot relationships in trending markets. The Kairi Relative...
技术分析 2021-06-19