A technical momentum indicator that compares the magnitude of recent gains to recent losses in an attempt to determine overbought and oversold conditions of an asset. It is calculated using the following formula:
RSI = 100 - 100/(1 + RS*)
*Where RS = Average of x days' up closes / Average of x days' down closes.
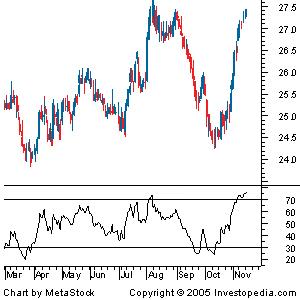
As you can see from the chart, the RSI ranges from 0 to 100. An asset is deemed to be overbought once the RSI approaches the 70 level, meaning that it may be getting overvalued and is a good candidate for a pullback. Likewise, if the RSI approaches 30, it is an indication that the asset may be getting oversold and therefore likely to become undervalued.
|||A trader using RSI should be aware that large surges and drops in the price of an asset will affect the RSI by creating false buy or sell signals. The RSI is best used as a valuable complement to other stock-picking tools.
