
Fibonacci Arc
外汇网2021-06-19 13:58:55
112
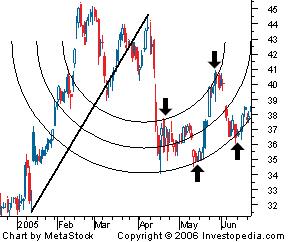
A charting technique consisting of three curved lines that are drawn for the purpose of anticipating key support and resistance levels, and areas of ranging.
标签:
- 上一篇: Kijun-Sen
- 下一篇: Hockey Stick Chart
随机快审展示
推荐文章
- 黑马在线:均线实战利器 8790 阅读
- 短线交易技术:外汇短线博弈精讲 4105 阅读
- MACD震荡指标入门与技巧 4237 阅读
- 黄金操盘高手实战交易技巧 4588 阅读
- 做精一张图 3336 阅读
热门文章
- 港币符号与美元符号的区别是什么啊? 25278 阅读
- 我国各大银行汇率为什么不一样啊? 15411 阅读
- 越南盾对人民币怎么算的?越南盾对人民币汇率换算方法是什么 10374 阅读
- 百利好环球欺诈,不给出金,无法联系。 9924 阅读
- 黑马在线:均线实战利器 8790 阅读